
If you want to reduce unplanned downtime, high maintenance costs or fluctuating quality in your manufacturing, the question is how manufacturing and maintenance should work together systematically. Many plants know individual building blocks such as autonomous or preventive maintenance without placing them into a robust overall concept. This article sorts the eight pillars, the core metrics and the rollout steps of total productive maintenance so you can derive an approach that fits your plant.
Key takeaways
Eight pillars combine continuous improvement, autonomous and preventive maintenance, training, quality maintenance, early equipment management, administration as well as health, safety and environment into one system.
OEE, MTTR and MTBF, together with six goal categories from productivity to motivation, show the effect and provide leading indicators.
A structured rollout starts with a target picture and governance, stabilizes standards in a pilot area and only scales afterwards.
Typical pitfalls are an oversized starting scope, missing training and a focus on checklists instead of root cause elimination.
Digital processes bring standards, findings and qualifications into one data flow and therefore improve traceability and response speed compared to paper or Excel.
What is total productive maintenance (TPM)?
Total productive maintenance (TPM) is a holistic maintenance concept that aligns manufacturing, maintenance, quality and leadership around a production system with as few disruptions as possible. It increases equipment effectiveness and equipment lifetime because teams systematically prevent technical, organizational and quality related losses.
TPM does not hand responsibility for capable equipment to the maintenance department alone. Machine operators spot deviations right where the work happens, take over defined routine tasks and contribute to continuous improvement. Specialized maintenance plans preventive measures, analyzes complex failures and improves technical reliability.
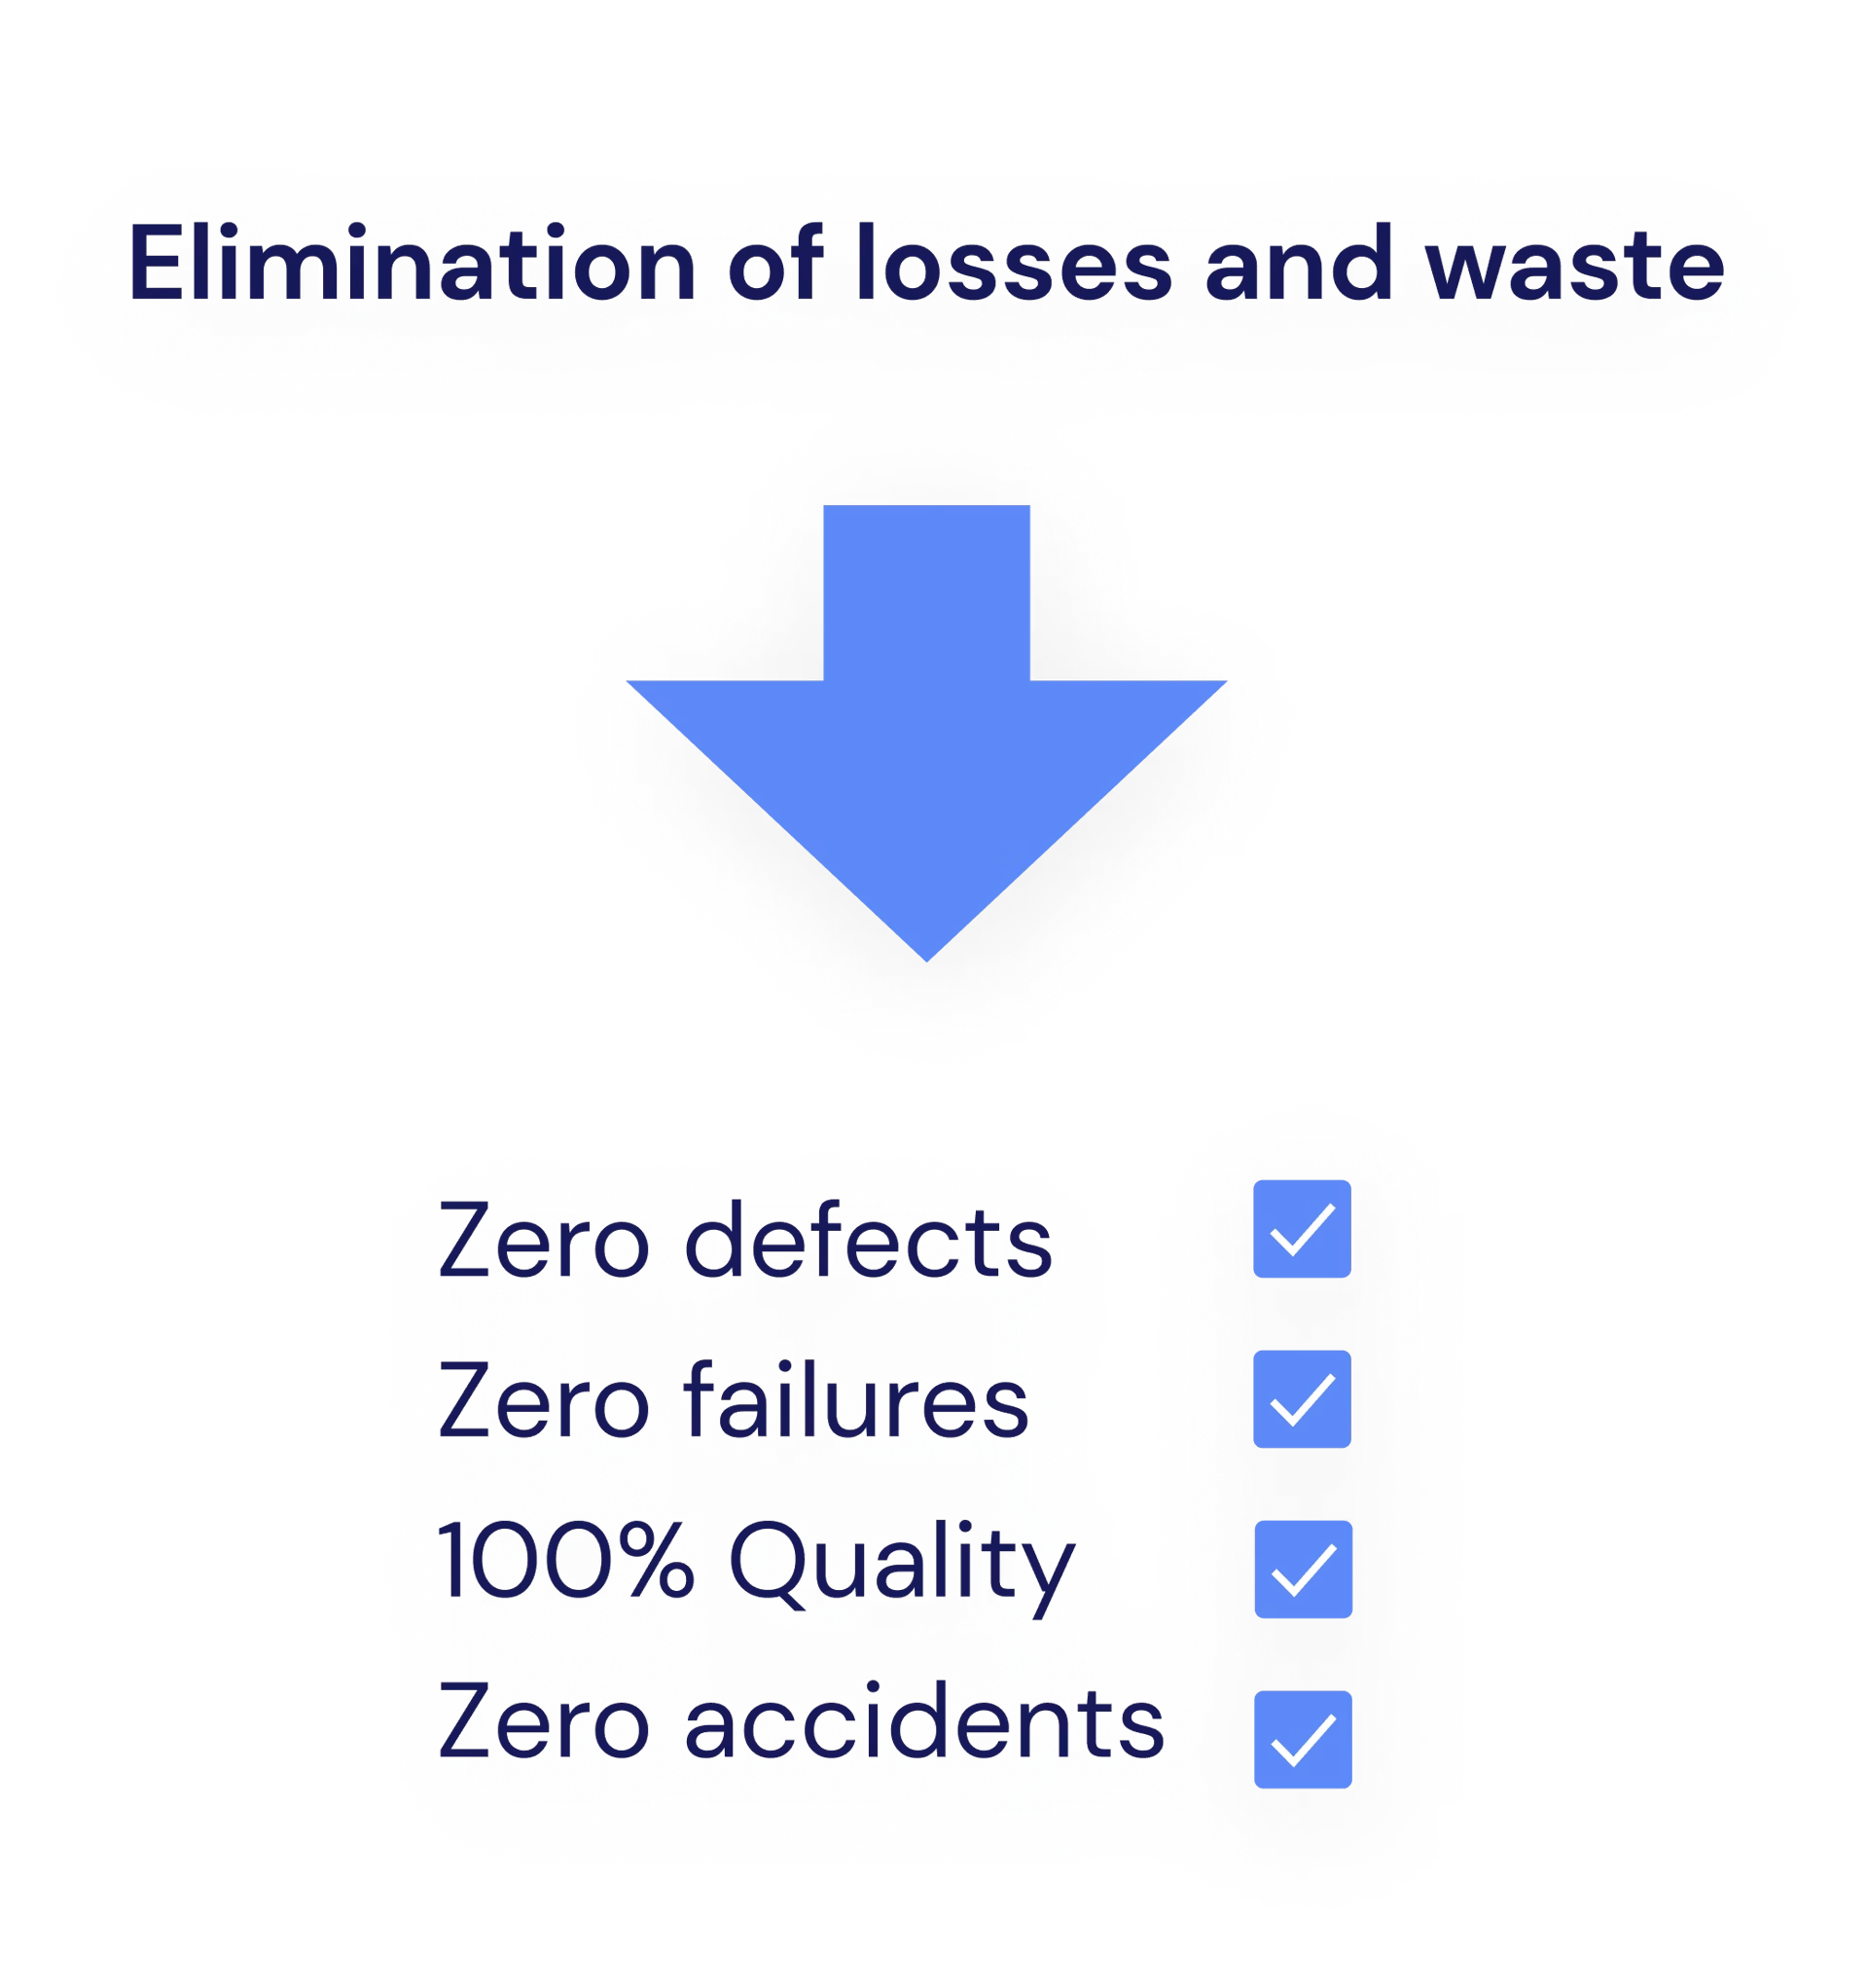
The target picture consists of four connected ambitions:
Zero defects: equipment and processes create no fault related quality losses.
Zero breakdowns: teams consistently avoid unplanned downtime.
Zero accidents: safe working conditions carry the same weight as productivity.
100 percent quality: every process step delivers the required result without rework or scrap.
These zero targets are a guiding principle, not a short term promise of success. What matters is making losses visible, removing causes sustainably and improving standards continuously. TPM is therefore neither a pure maintenance program nor a temporary initiative. It is a long term production system and it requires clear roles, robust standards and leadership on the shopfloor.
How does TPM compare to reactive, preventive and autonomous maintenance?
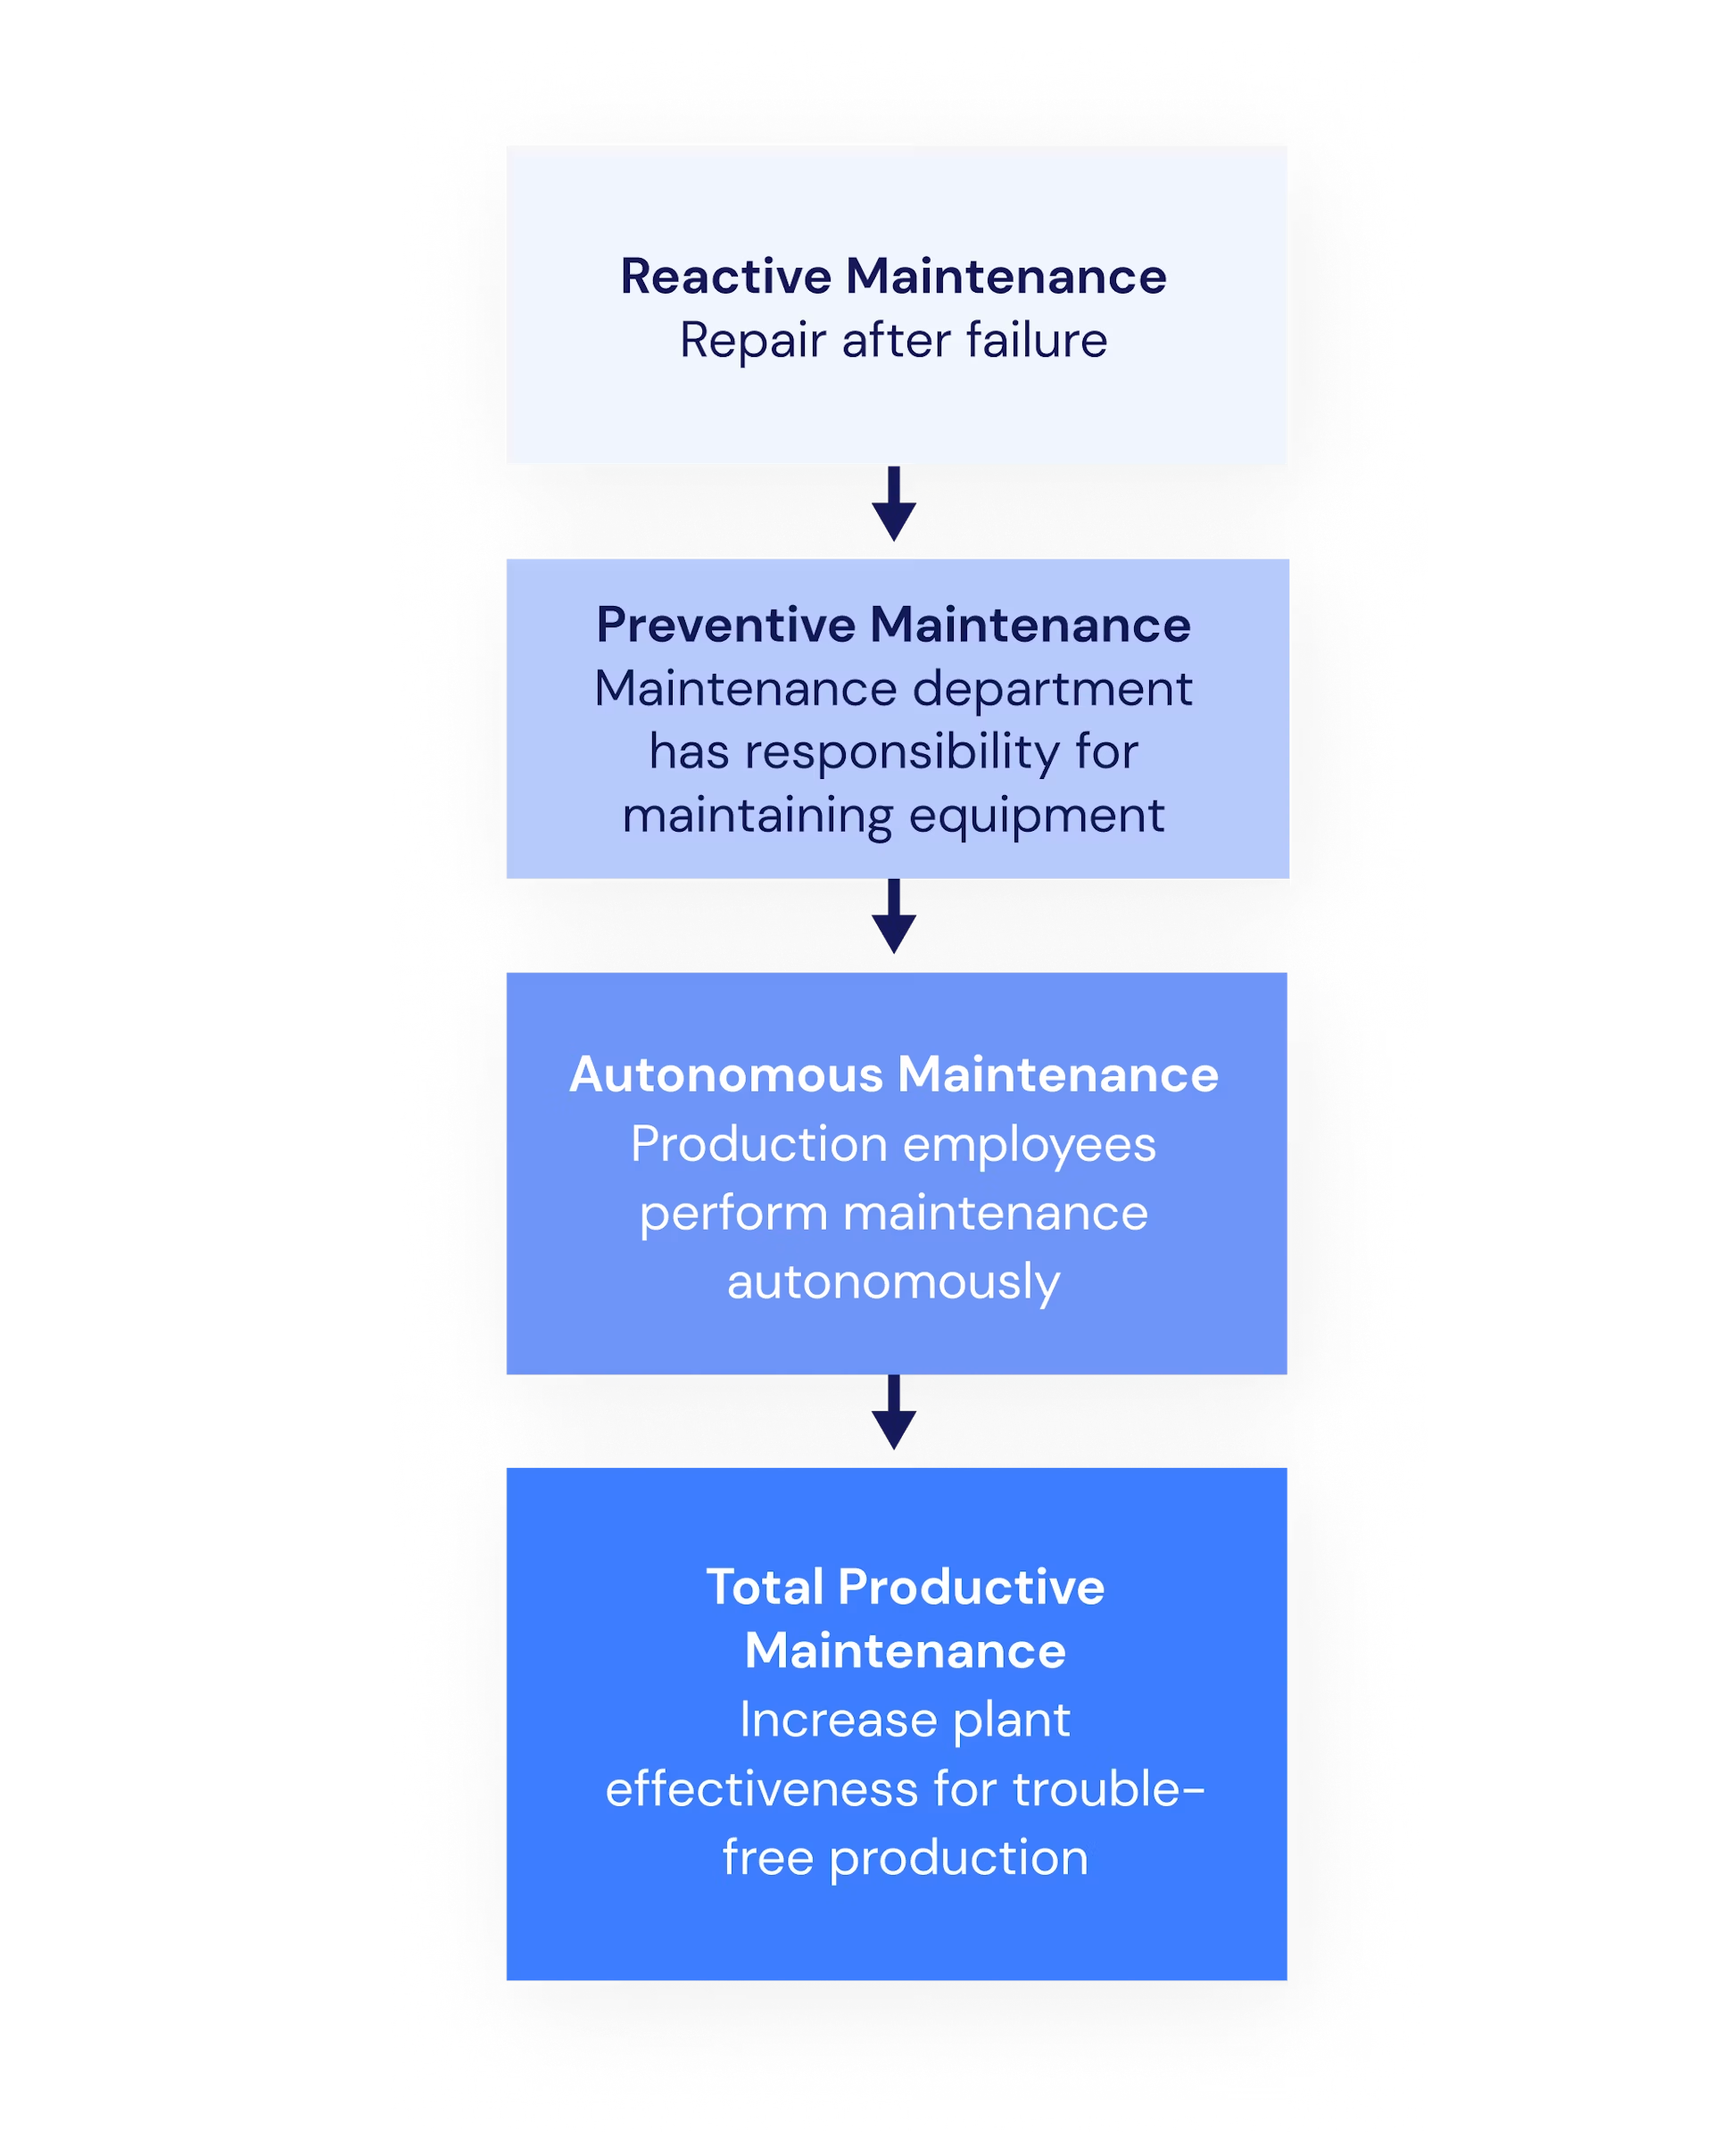
Reactive maintenance steps in after the failure, preventive maintenance works ahead of the failure, autonomous maintenance involves the operators, and TPM combines these elements into a cross functional management system. The essential difference therefore lies not only in the timing of maintenance, but in responsibility, data basis and improvement logic.
| Development stage | Trigger and approach | Main responsibility | Typical limitation |
|---|---|---|---|
| Reactive maintenance | Repair after a disruption or a breakdown | Maintenance | High downtime risk and resources that are hard to plan |
| Preventive maintenance | Time, usage or condition based servicing ahead of failure | Mainly maintenance | Unnecessary servicing with blanket intervals, little operator involvement |
| Autonomous maintenance | Cleaning, inspection, lubrication and basic care according to standards | Manufacturing with support from maintenance | Without training and escalation rules, safety and quality risks arise |
| Total productive maintenance | Joint loss elimination across the entire equipment lifecycle | Manufacturing, maintenance, quality, planning and leadership | High rollout effort and permanent leadership demand |
The four stages describe a development, not an either or decision. Even a TPM system needs reactive capabilities for unavoidable disruptions and preventive plans for wear critical components. In practice, TPM works when a plant combines these approaches on a risk basis and trains operators only for clearly released tasks. So first check which stage your critical equipment is actually on today.
Which eight pillars make up total productive maintenance?
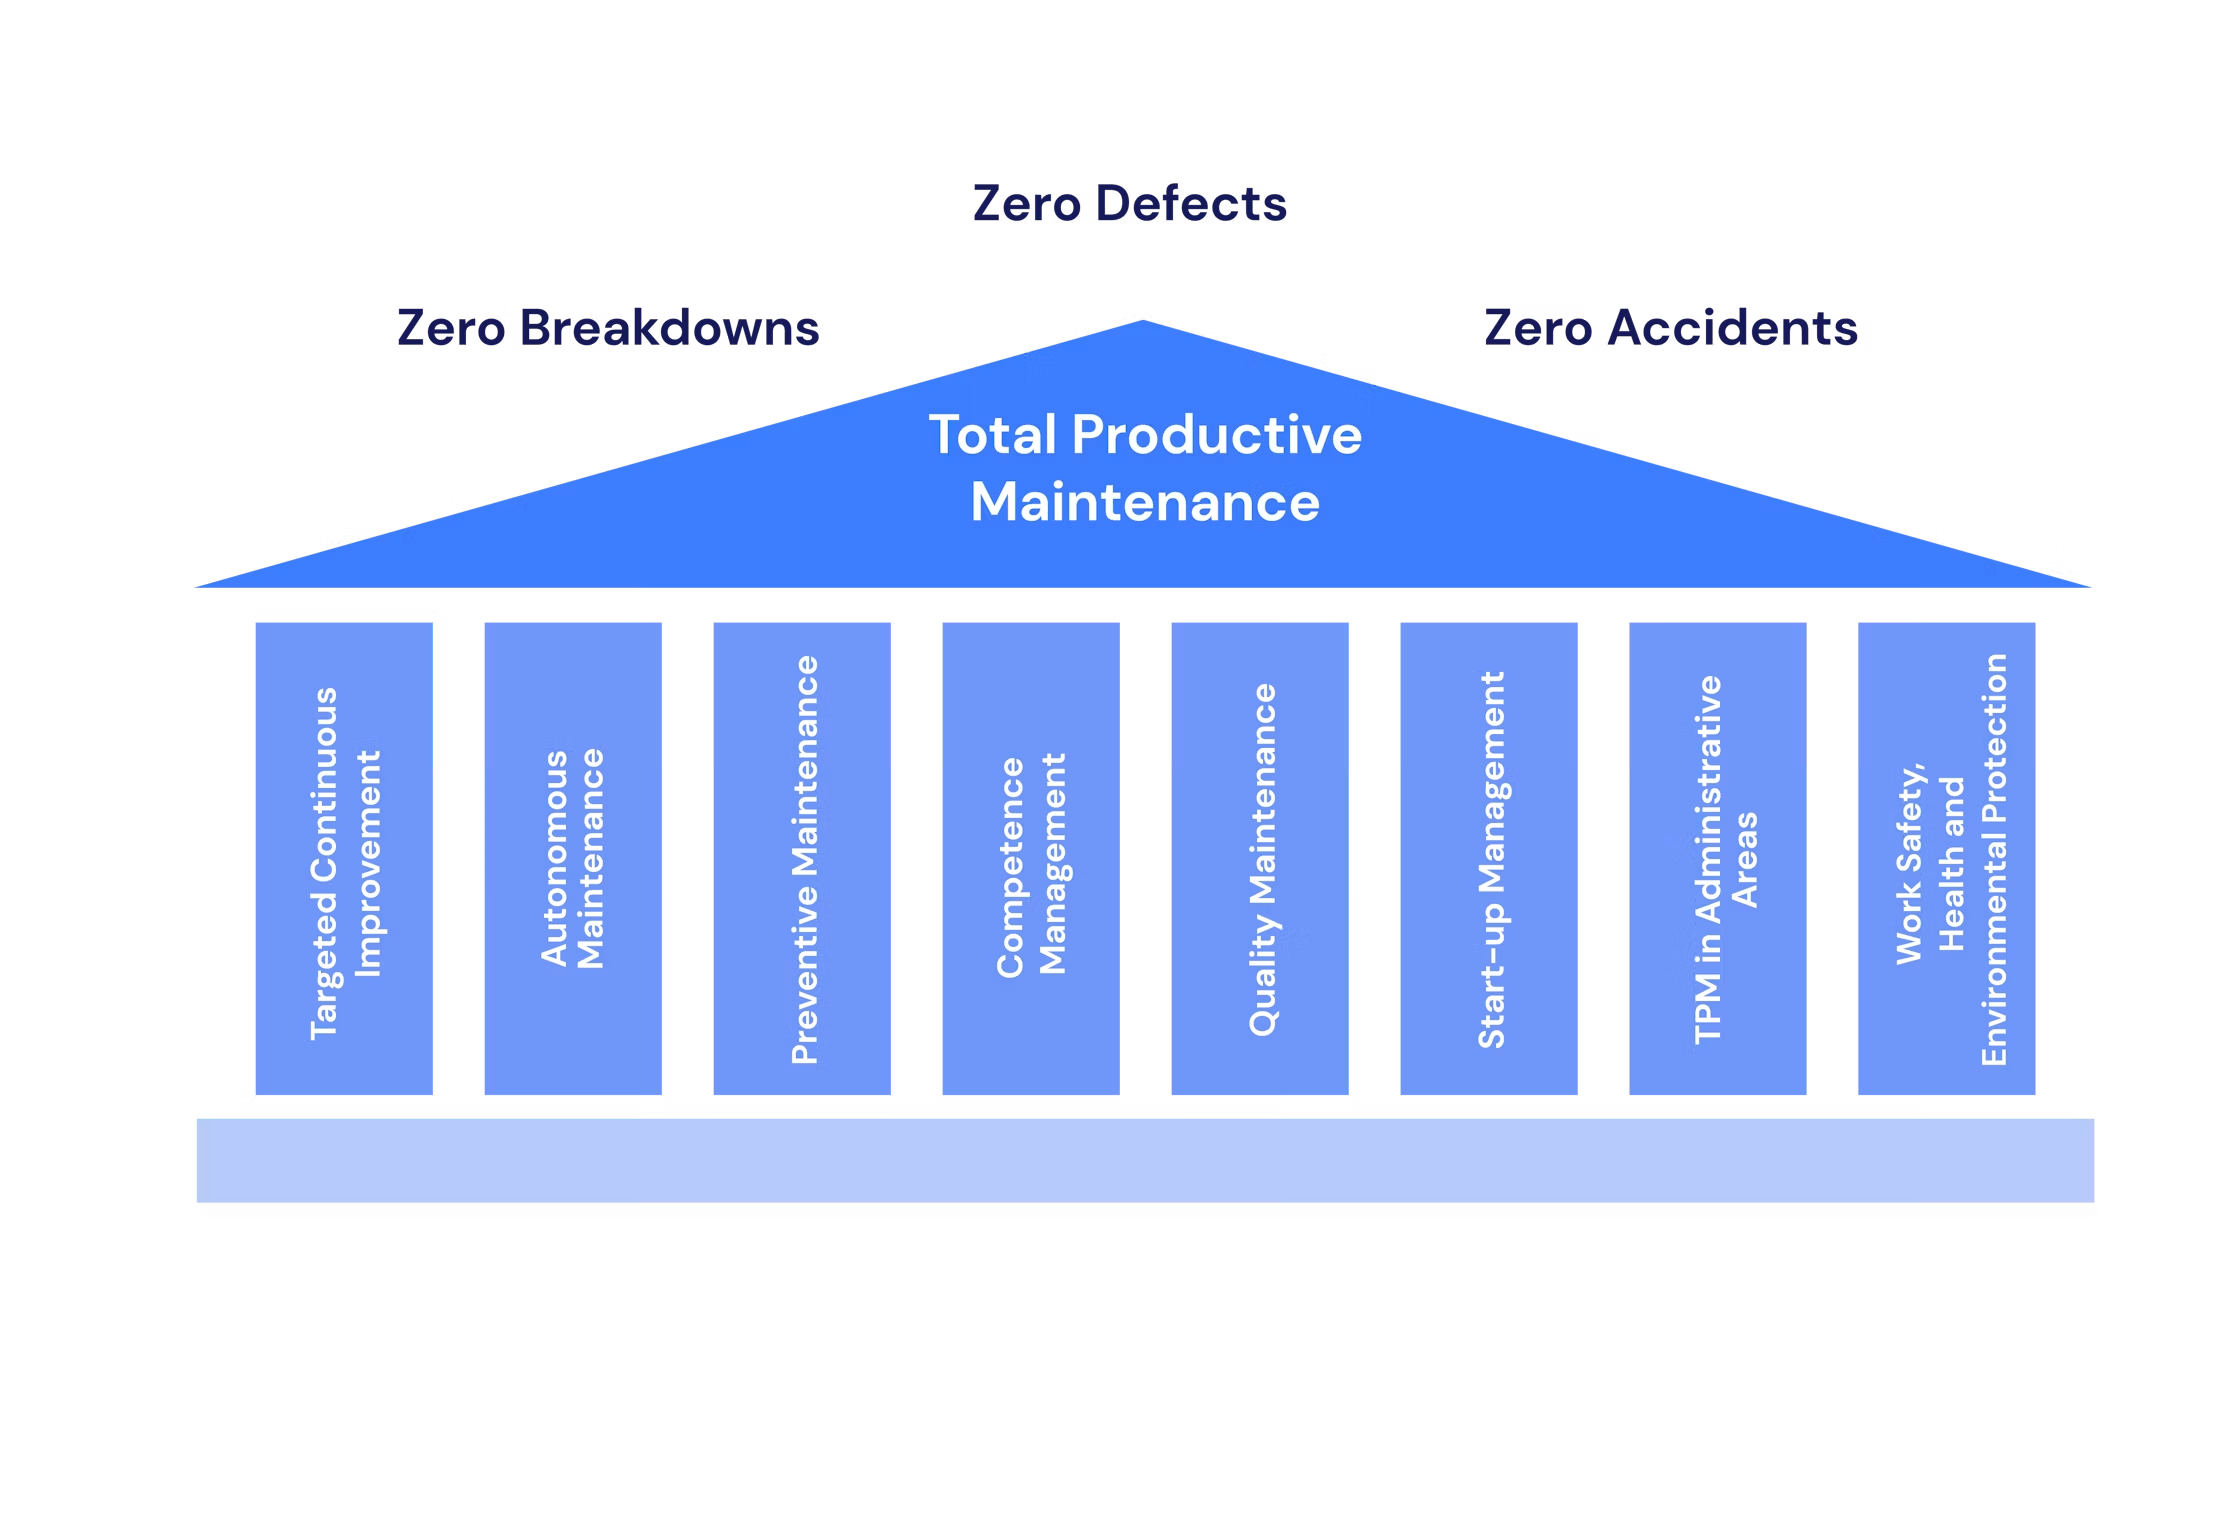
The eight pillars of TPM connect technical reliability with quality, qualification, ramp up planning, administration as well as health, safety and environment. Only their coordinated interplay turns individual maintenance activities into a holistic production system.
The eight pillars are:
Focused continuous improvement: prioritize losses, remove causes and establish effective standards.
Autonomous maintenance: operators take over released cleaning, inspection, lubrication and care tasks.
Preventive maintenance: servicing and condition monitoring prevent unplanned breakdowns.
Competency management: role based training creates the basis for safe and correct execution.
Quality maintenance: teams control process conditions so that defects do not occur in the first place.
Early equipment management: insights from operations and maintenance feed into new products and machines early.
TPM in administrative areas: supporting processes are stabilized with lean and 5S principles.
Health, safety and environment: teams systematically reduce risks, accidents, emissions and resource losses.
Do not run the pillars as eight separate projects. A lubrication standard, for example, touches autonomous maintenance, training, occupational safety and quality maintenance at the same time. What matters is joint steering with unambiguous responsibilities.
Focused continuous improvement
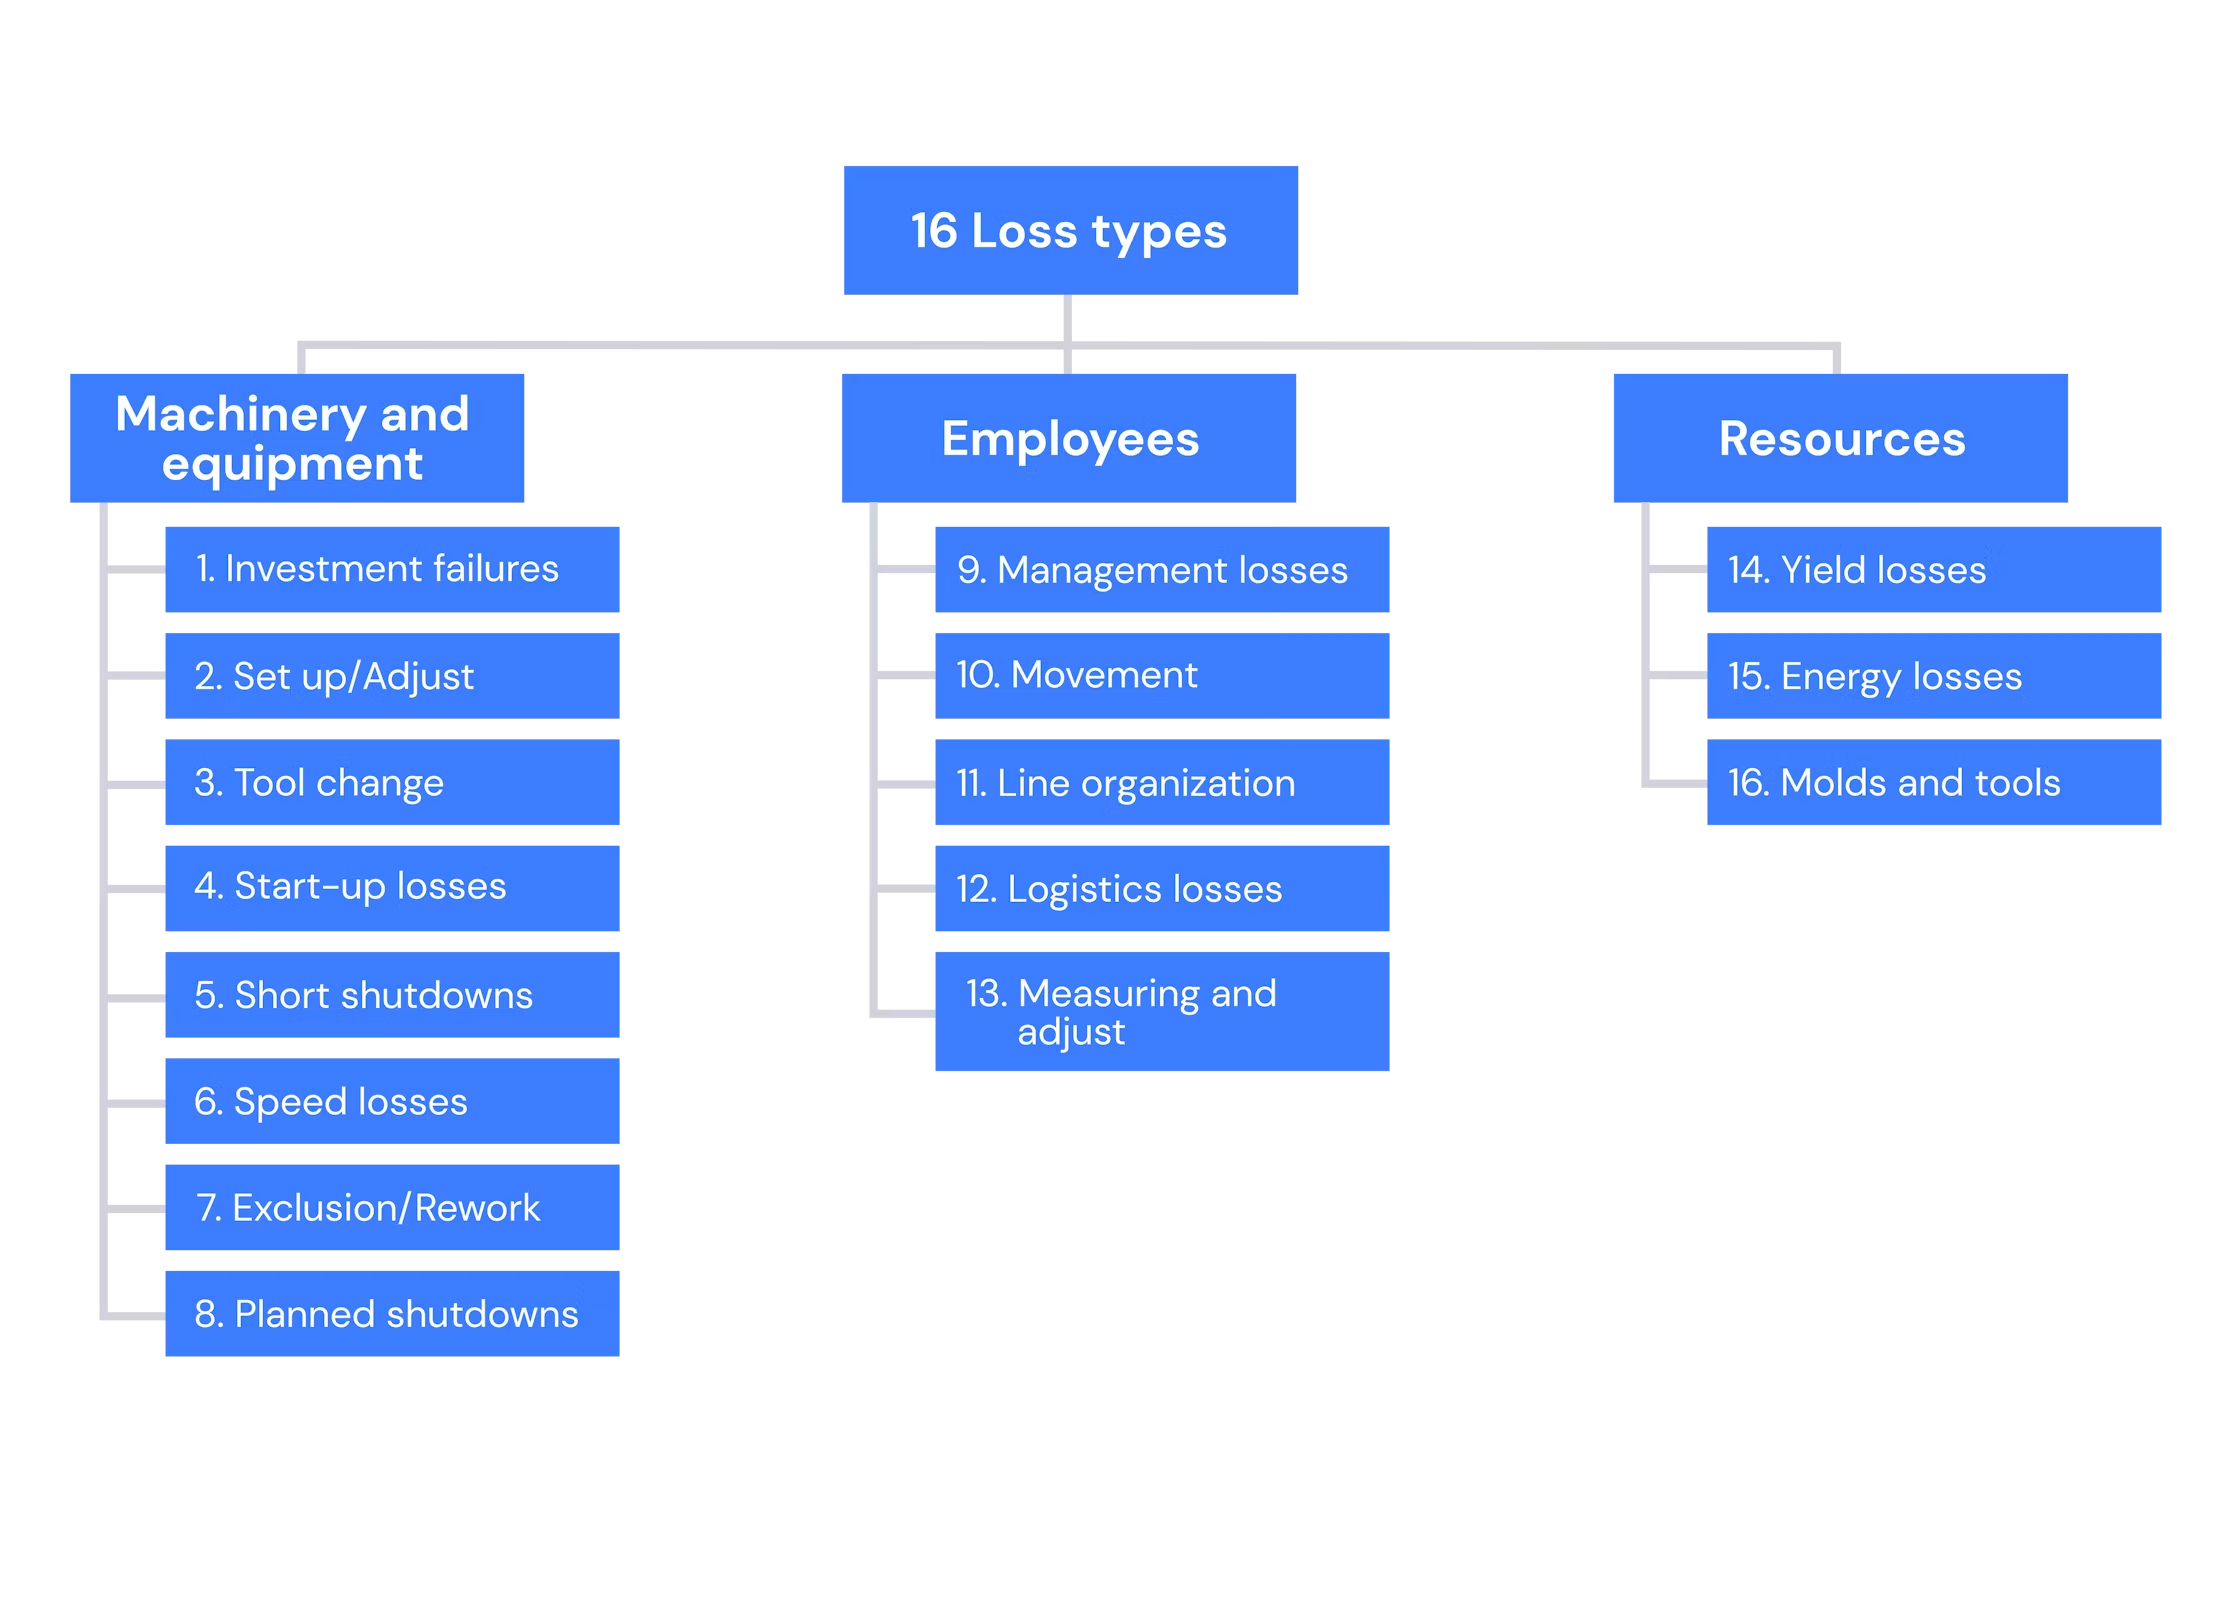
Focused continuous improvement concentrates improvement and kaizen activities on measurable loss causes instead of unspecific individual ideas. Teams tackle recurring stops, speed losses, long setup processes, quality defects, energy losses and safety risks based on their impact on the overall process.
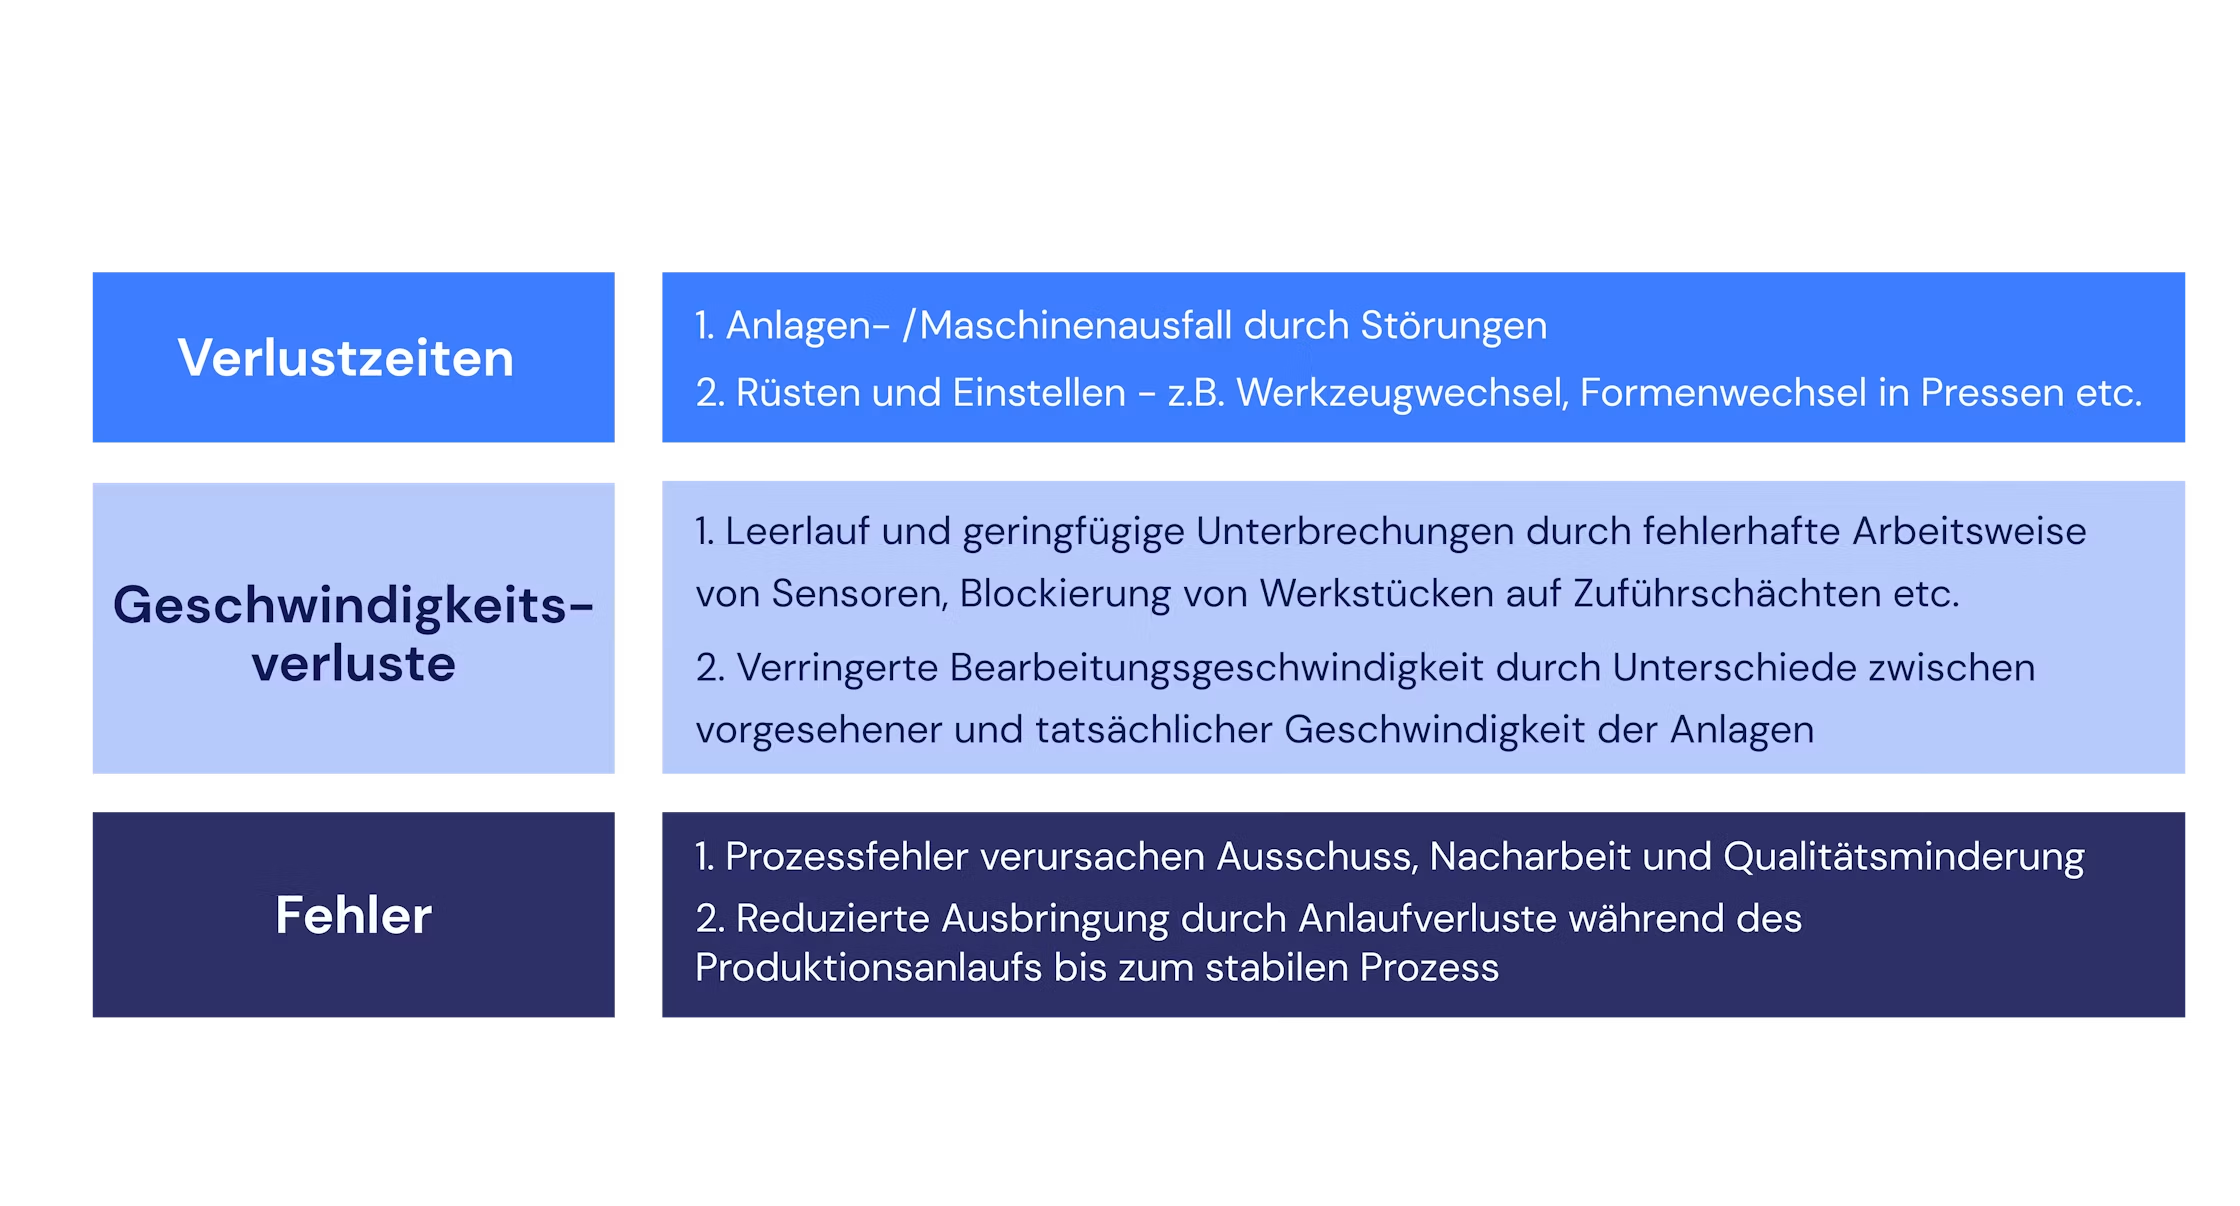
TPM looks at loss types in the areas of equipment, human work as well as material and energy. For the shopfloor, unplanned breakdowns, setup and adjustment losses, minor stops, reduced speed, ramp up losses and scrap are particularly relevant.
A robust improvement cycle covers:
Describe the loss with data and observations at the gemba.
Assess the impact on OEE, lead time, cost, quality and safety.
Choose the focus based on frequency, duration, risk and follow up cost.
Investigate the cause with Pareto analysis, 5 Why, Ishikawa or FMEA.
Test the countermeasure and verify its effect using the same metric.
Transfer the successful solution into standards, work instructions and training.
The most common mistake here is activism. Anyone who only repairs the visible defect leaves the systemic cause in place. In practice, a clearly bounded loss topic works well when a cross functional team takes it all the way through to the new standard.
Which tasks do machine operators take over in autonomous maintenance?
Machine operators take over simple, recurring and safely released tasks such as cleaning, inspecting, lubricating and tightening. Autonomous Maintenance helps them detect leaks, wear, unusual noises or loosened connections early. Specialized maintenance gains more time for diagnosis, planning and complex repairs.
Typical tasks are:
clean the machine and accessible components according to a defined standard
check fill levels, pressures, temperatures and visible signs of wear
supply released lubrication points with the specified lubricant
visually inspect guards, sensors and lines
document deviations with a photo, a measured value and a fault class
carry out simple corrections within clear competency limits
report critical findings through a defined escalation path
Autonomous maintenance does not mean shifting skilled work into manufacturing without control. Work on electrical systems, safety devices or pressurized systems remains reserved for qualified and authorized people. A release matrix, lockout tagout rules, standardized checklists and documented instructions create the necessary boundary.
In practice, autonomous maintenance starts with initial cleaning and a first inspection. The team removes hard to reach spots, marks target conditions and only then develops regular standards. This sequence prevents employees from merely managing contamination instead of removing its causes.
Preventive maintenance, MTTR and MTBF
Preventive maintenance plans measures ahead of functional failure and sets intervals based on time, usage, condition or risk. TPM pursues two central directions here: lower the mean time to repair (MTTR) and increase the mean time between failures (MTBF).
MTTR, mean time to repair, describes the average time needed to restore operation after a failure. A low MTTR results from fast diagnosis, available spare parts, accessible components, unambiguous work instructions and practiced escalation routines.
MTBF, mean time between failures, describes the average operating time between failures in repairable systems. A high MTBF indicates technical reliability, provided teams record failures and operating times consistently.
The metrics serve different purposes:
Minimize MTTR: improve repairability and response speed.
Maximize MTBF: remove failure causes and increase reliability.
Optimize the maintenance plan: adjust intervals based on findings, failure history and criticality.
Prioritize spare parts: stock critical parts according to failure risk, lead time and production impact.
Not every component needs a rigid maintenance interval. Time based servicing suits known ageing mechanisms and mandatory inspections. Condition based maintenance is the better choice when measurements such as vibration, temperature, particles or current draw provide a reliable wear indicator. Running to failure remains economically defensible for non critical, redundant and quickly replaceable components. The recommendation is therefore: define the strategy per asset based on criticality, failure pattern and data quality, not as a blanket rule for the whole plant.
Competency management as the foundation of the pillars
Competency management makes sure every person performs their TPM tasks safely, correctly and reproducibly. Without role based qualification, employees tick off checklists formally, assess deviations incorrectly and push responsibility back and forth between manufacturing and maintenance.
A robust skills matrix connects role, asset, activity and release status. It shows, for example, which machine operators run a first inspection, which maintenance technicians lead a failure analysis and which shift leads may release standards.
Effective training covers more than course certificates:
theoretical understanding of losses, machine functions and safety rules
practical demonstration directly at the machine
supervised execution with feedback
documented competency release
refresher instruction after a change, an incident or a deadline
effectiveness check based on actual work execution
Leaders additionally need competency in shopfloor management, coaching and metric interpretation. So steer qualification not by completed courses, but by demonstrated capability.
Quality maintenance and the zero defect goal
Quality maintenance defines and monitors the equipment and process conditions under which defect free products are made. It shifts the focus from downstream inspection to defect prevention and connects TPM with quality management.
A quality matrix assigns defect patterns to the relevant process parameters, machine components, inspection characteristics and reaction plans. Trend analyses make creeping deviations visible before scrap or customer complaints occur. Poka Yoke prevents mistakes by design or detects them immediately at the process step.
Typical measures are:
define critical quality characteristics and process parameters unambiguously
make target ranges visible at the machine
safeguard measurement systems and inspection equipment
analyze defect causes with 8D, Ishikawa or FMEA
standardize reaction plans for limit violations
prevent recurring defects technically with poka yoke
Zero defects requires stable technical base conditions. When play, contamination, tool wear or sensor drift affect quality, controlling them belongs in the maintenance standard and not in final inspection alone.
Early equipment management for new machines and products
TPM early equipment management transfers operating experience into the design, procurement, installation and ramp up of new machines and products at an early stage. The goal is a short, stable ramp up curve with good maintainability, safe operation and controlled quality characteristics.
Equipment planning, manufacturing, maintenance, advanced quality planning and suppliers define the requirements together. This includes accessible maintenance points, standardized components, diagnostic data, spare part concepts, safe cleanability and ergonomic inspection routes.
Proven instruments are:
documented experience from disruptions and improvement projects
design FMEA and process FMEA
maintainability and accessibility assessments
specifications with requirements for MTTR, diagnostics and documentation
spare part and qualification concepts before the production start
FAT/SAT with realistic operating, maintenance and failure scenarios
The most common mistake is involving maintenance too late. After acceptance, poor accessibility, proprietary components or missing diagnostic interfaces can only be corrected at high cost. So involve maintenance and operators already in the specification and the design review.
TPM and 5S in administrative areas
TPM transfers the principle of stable, low loss processes to purchasing, logistics, planning, human resources and other administrative functions. The 5S Method creates transparency, standards and reliable information flows there.
The five steps are:
Sort: remove unnecessary files, forms, stock and process steps.
Set in order: organize information, responsibilities and storage locations clearly.
Shine: clean up data errors, duplicates and outdated content.
Standardize: harmonize naming, handovers, approvals and processing rules.
Sustain: keep standards alive through routines, audits and leadership.
Concrete sources of loss are missing spare part master data, unclear purchase approvals, duplicate data entry, delayed qualification records and long searches for information. 5S in the office is therefore not a pure tidying exercise. What matters is a measurable improvement in lead time, data quality and process reliability.
Health, safety and environment
Health, safety and environment is a TPM pillar in its own right, with the goal of zero accidents and lower environmental and resource impact. Productivity improvements only count as sustainable when they ensure safe work and controlled environmental effects.
Employees must recognize hazards, stop work in the case of critical deviations and trigger defined countermeasures. Safety walks, near miss reports, risk assessments and lockout tagout procedures connect technical maintenance with systematic occupational safety.
For environmental protection, energy and water consumption, leaks, waste, noise and pollutant emissions are in focus. A leaking compressed air line, for example, is at the same time a technical defect, an energy loss and a possible safety risk. TPM treats such connections together instead of in separate action lists.
Which metrics measure the success of TPM?
TPM steers with one central result metric, OEE, and complements it with metrics from six goal categories, from productivity to motivation. Only this combination shows you whether losses actually disappear or merely move somewhere else.
How is OEE calculated?
Overall equipment effectiveness (OEE) measures which share of the planned production time is actually used to make good parts at the intended speed. It bundles availability, performance and quality and therefore makes three central loss dimensions of TPM visible.
The calculation is:
OEE = availability × performance × quality rate
The following relationships apply:
Availability: actual run time in relation to planned production time
Performance: actual output in relation to theoretical output during run time
Quality rate: good quantity in relation to total quantity
TPM improves availability through fewer breakdowns and shorter repairs. It increases performance because teams remove minor stops, reduced speed and unstable cycles. Quality maintenance reduces scrap and rework.
Still, OEE is not an end in itself and not a complete plant metric. A high OEE on a machine that is not a bottleneck does not automatically improve delivery reliability or value creation. In the same way, inconsistent definitions for planned time, downtime reasons or good quantity distort every comparison. In practice, OEE works well as a loss indicator at machine or line level, complemented by throughput, on time delivery, cost and safety metrics.
Metrics across the six goal categories
A TPM rollout should track metrics from six goal categories: productivity, quality, cost, logistics, safety and environment, and motivation. A balanced set of metrics prevents higher output at the expense of quality, employees or equipment condition.
Productivity: OEE, labor productivity, value creation per person, unplanned downtime, failure frequency, MTBF, MTTR, setup time and output at the bottleneck.
Quality: scrap rate, rework rate, process defects, first pass yield, customer complaints and the number of recurring defects.
Cost: maintenance cost, cost of unplanned breakdowns, spare part cost, cost of external service providers, energy and scrap cost.
Logistics: lead time, inventory level, stock turnover, on time delivery, missing parts and coverage of critical spare parts.
Safety and environment: accidents, near misses, absenteeism, identified hazards, energy and water consumption, waste, leaks and emissions.
Motivation and participation: implemented improvement suggestions, participation in small group meetings, qualification coverage, adherence to autonomous standards and completion rate of agreed measures.
Every metric needs a definition, a data source, an owner, a measurement rhythm and a link to the goal. Pure activity metrics such as the number of completed checklists are not enough. They show execution, but no effect.
Limit yourself to a small metric set per pilot area. Combine a result metric such as OEE or unplanned downtime with leading indicators such as overdue maintenance, open critical findings and qualification coverage. That way your team sees not only that a result is deteriorating, but also why.
Is TPM worth it? Benefits and effort at a glance
TPM pays off where recurring losses and dependence on individual experience slow the operation down, but it requires upfront investment in cleaning, training, data and leadership. Assess both sides before you set up a program.
Benefits on the shopfloor
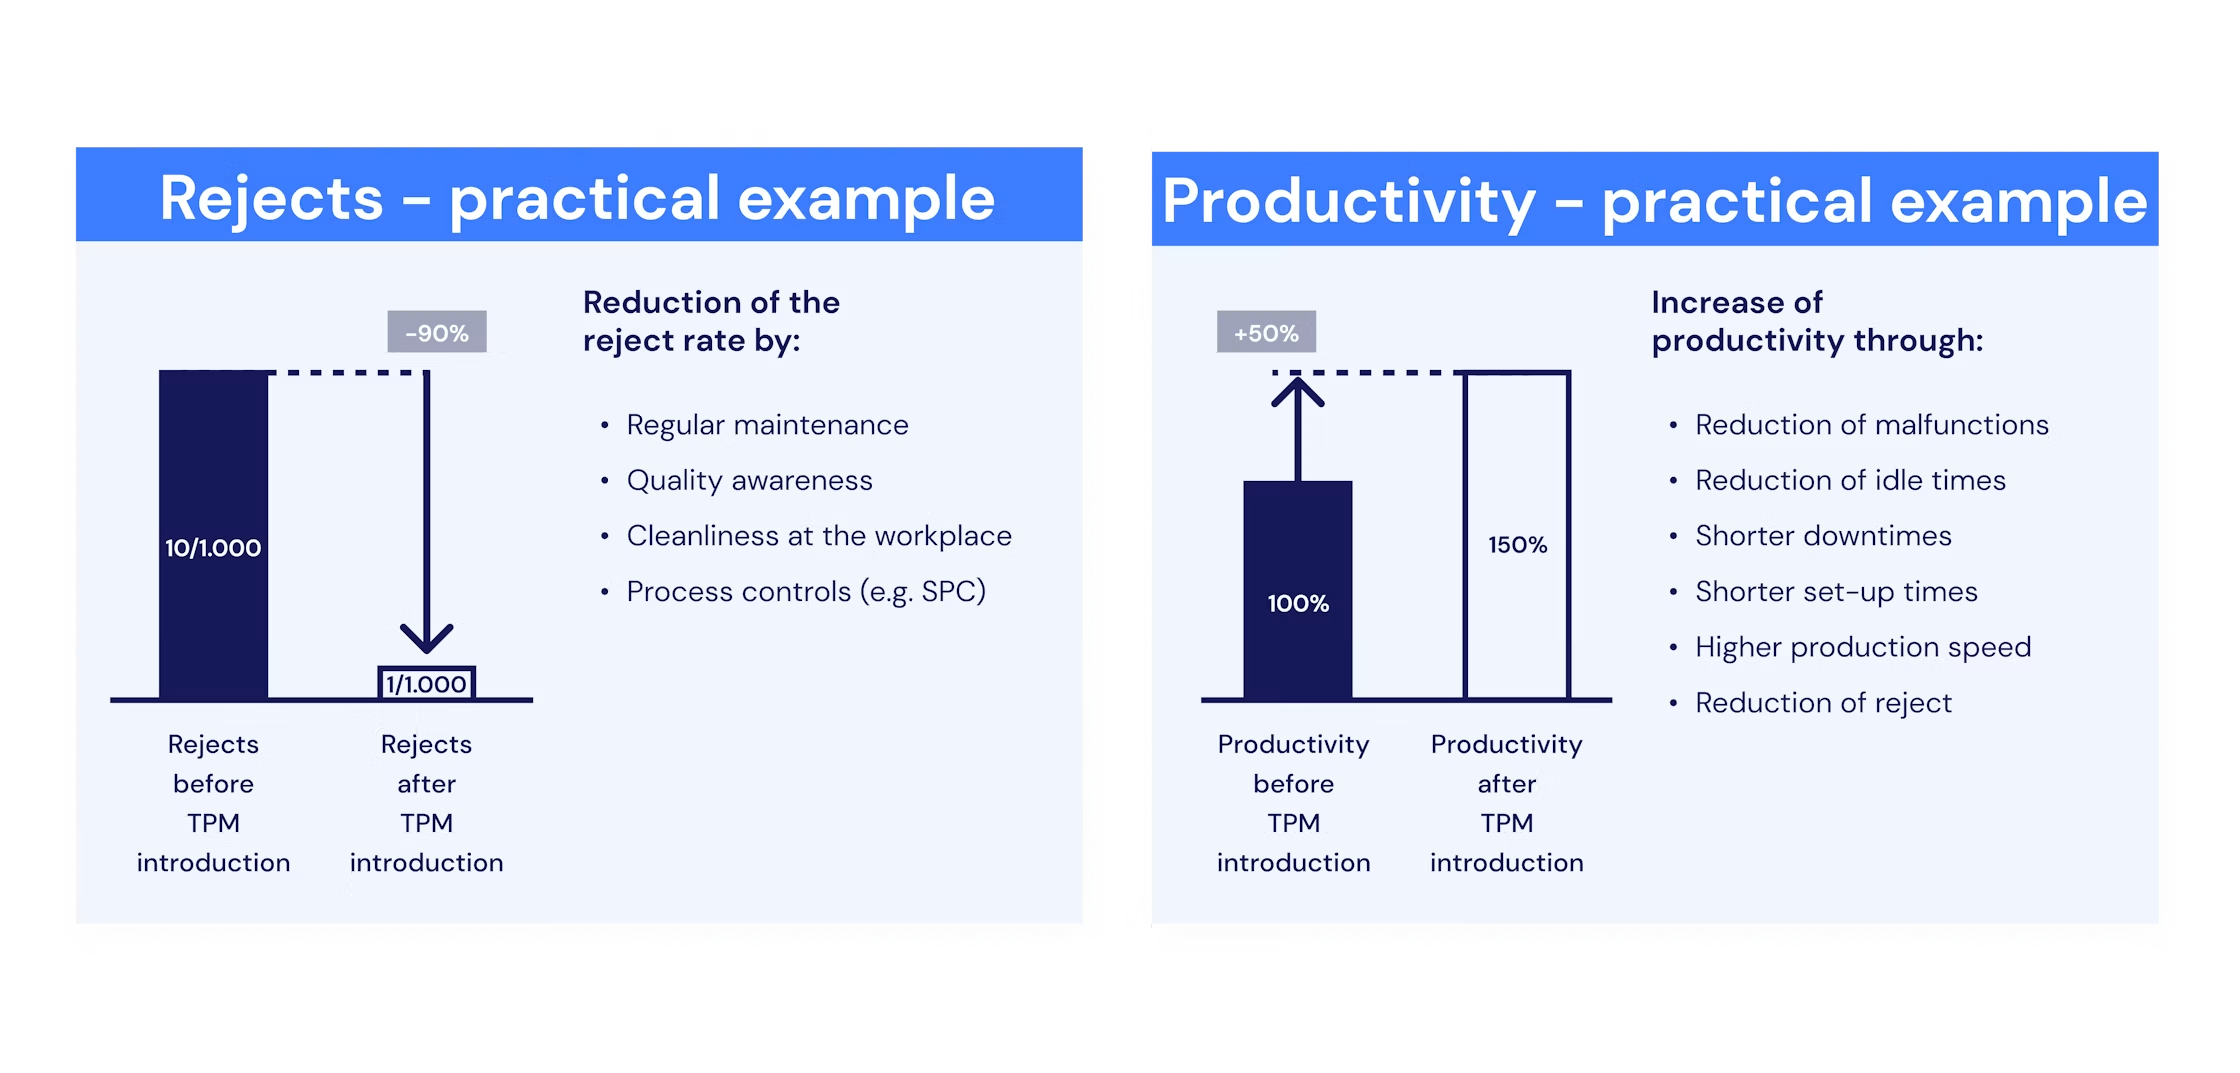
Consistently implemented TPM reduces technical and organizational losses and at the same time strengthens problem solving capability on the shopfloor. The benefit does not come from additional checklists, though, but from earlier fault detection, clear standards and sustainable root cause elimination.
The key benefits include:
fewer unplanned malfunctions and machine stoppages
less scrap and less rework
shorter setup, adjustment and restart times
higher equipment availability and more stable productivity
better transparency on maintenance cost and loss causes
relief for maintenance from suitable routine tasks
less dependence on the experience of individual employees
safer work sequences and hazards identified earlier
higher participation and ownership among production employees
greater operational resilience in the face of skills shortages, product variety and external disruptions
The changed way of working together is particularly valuable. Operators do not just report a broken machine, they deliver standardized findings. Maintenance technicians do not only act as a fire brigade, they develop equipment and maintenance strategies systematically. This shift in roles increases problem solving speed and secures knowledge across shifts and sites.
Drawbacks and typical pitfalls
The central drawback of TPM is the considerable rollout and leadership effort before stable results appear. Missing priority, insufficient training and a half hearted culture change quickly turn TPM into additional bureaucracy.
Typical pitfalls are:
Oversized starting scope: a plant wide rollout ties up resources before standards have been tested in a pilot.
Unclear goals: general demands for better maintenance do not create priorities.
Missing base data: incomplete asset structures and inconsistent failure reasons prevent robust analyses.
Too little training: operators receive tasks without mastering edge cases, safety rules and escalation.
Task shifting instead of collaboration: manufacturing experiences autonomous maintenance as extra work, maintenance as a loss of competency.
Focus on checklists: teams document activities but remove no causes.
Impatience about profitability: owners cancel early effort for cleaning, training, data upkeep and standards before the effect kicks in.
Missing leadership on the shopfloor: open findings stay unresolved and standards lose their binding character.
Rigid maintenance intervals: plans keep growing although finding data calls for an adjustment.
TPM requires step by step learning, openness and a high level of ownership. It is not a project with a final completion date. When you plan goals, capacity and decision rights realistically, you limit the effort and create visible progress.
How do I roll out TPM step by step?
A robust TPM rollout starts with clear goals and a limited pilot area, stabilizes standards there and only scales after the effect is proven. This sequence protects you from an expensive rollout of immature processes.
Define the target picture and business value: define which losses TPM addresses and how productivity, quality, cost and safety should benefit.
Set up the program and governance: define milestones, dates, funding, roles and decision paths. Name an accountable sponsor and a cross functional core team.
Structure assets and criticality: break down plant, lines, machines and components unambiguously. Assess assets by safety, quality, delivery impact, failure frequency and replacement risk.
Capture the baseline: document defects, disruptions, maintenance plans, OEE losses, qualifications and safety findings. Harmonize fault codes and time definitions.
Select the pilot area: choose a relevant but manageable line with committed leadership, sufficient data and recurring losses. A perfectly stable showcase machine delivers little learning value, an area in permanent crisis overwhelms the team.
Establish the base condition: clean and inspect the pilot machine together. Remove defects, sources of contamination and hard to reach inspection points. Mark target conditions visibly.
Define tasks and standards: assign autonomous, preventive and reactive activities unambiguously. Describe execution, interval, tool, limit value, safety rule and escalation.
Train and release employees: train tasks directly at the machine, observe the execution and document the competency release.
Establish a steering routine: discuss findings, losses and overdue measures in short shopfloor routines. Prioritize by risk and production impact.
Verify the effect and improve standards: compare MTBF, MTTR, downtime, quality and safety findings against the baseline. Adjust intervals and work documents based on the results.
Standardize experience and scale: transfer proven approaches to similar machines and further areas. Also reflect the insights in specifications, procurement concepts and FAT/SAT for new equipment.
The concrete recommendation is: do not start by digitizing all maintenance plans or with a plant wide training program. First stabilize roles, standards, data and leadership routines on a representative pilot machine. Then scale only those elements whose effect and everyday practicality are proven.
Involving leaders, production employees and maintenance technicians
Every target group needs a different form of involvement: leaders need clarity of goals and steering competency, production employees need practical confidence, and maintenance technicians need an active role as technical experts and improvers. Identical presentations for all groups are not enough for the culture change required.
Leaders
For leaders, compact talks and workshops on business goals, roles, metrics and escalation paths work well. They must protect time for initial cleaning, training and root cause analysis. Above all, they must respond to open deviations instead of only demanding output.
Production employees
Production employees learn most effectively through training at the workplace. A trainer demonstrates cleaning, inspection, servicing and safe restart on the real machine. The employees then compare the TPM standard with the previous approach, practice themselves and receive a documented release.
Maintenance technicians
Maintenance technicians need a clear future role. They move from a pure fire brigade function to technical service providers, analysts, trainers and drivers of equipment improvement. This requires management to genuinely reserve the freed up time for root cause analysis, preventive planning and technical optimization.
How can TPM be implemented digitally instead of on paper or in Excel?
Digital TPM processes bring standards, execution, findings, qualifications and measures together in one continuous data flow. Compared to paper and isolated Excel files, they improve currency, traceability and response speed, provided asset structure and processes have been cleanly defined beforehand.
| Criterion | Paper or isolated Excel | Digital, integrated implementation |
|---|---|---|
| Currency | Distributed versions and manual changes | Centrally released, versioned standards |
| Execution | Ticking off without guided reaction to findings | Conditional steps, limit values and direct escalation |
| Finding quality | Free text, later transfer, missing context | Time stamp, asset reference, measured value, photo or video |
| Measures | Handover by word of mouth, email or a separate list | Ownership, priority, deadline and status in one workflow |
| Qualification | Separate training lists | Task release based on role and competency status |
| Analysis | High manual consolidation effort | Continuous analysis of disruptions, findings and intervals |
| Audit readiness | Searching folders and archives | Versions, releases and execution history fully traceable |
Digitalization does not replace TPM methodology. A poor paper process stays a poor process on a tablet too. So first clarify responsibilities, escalation rules and target conditions, then map them digitally.
Which problems arise from separate systems for maintenance, inspection and qualification?
Separate systems create media breaks, duplicate data upkeep and delayed responses, because maintenance planning, machine inspection, health, safety and environment as well as qualifications do not share a common context. This becomes particularly critical when findings are created on paper and employees transfer them into ERP, MES or CMMS manually later on.
Typical consequences are:
differing asset names and master data
outdated checklists at the point of use
findings without a direct link to the order and the component
measured values and fault descriptions recorded multiple times
measures without clear ownership
deployment of people without a current qualification record
laborious evidence gathering for audits
A connected worker approach closes the operational gap between employees on the shopfloor and the systems of record. ERP, MES and CMMS keep their tasks for resources, production control and maintenance planning. An integrated execution layer provides employees with current work instructions and checklists, captures findings in the work context and passes relevant status data on through defined interfaces.
A clear system architecture is decisive. For each data type, exactly one system must be the system of record. Otherwise, digitalization creates new duplicates and contradictory maintenance states anyway.
TPM execution with Operations1
If you keep maintenance plans, inspection checklists and qualification records in separate systems or on paper, you get exactly the media breaks and duplicate upkeep that make effective TPM steering harder. Operations1 maps work instructions, inspection protocols and inspection forms as digital, versioned documents and captures findings directly in the process through structured interactions such as numeric entries with limit values, photo capture or signatures.
Qualification management automatically checks whether a person is released for a document and blocks access when the qualification is missing. That safeguards operator involvement in autonomous and preventive maintenance. Notable findings can be followed up straight from the report as a task with an owner, a deadline and a status, so reporting no longer runs by word of mouth or through separate lists.
Through connectors and the public API, Operations1 also connects orders from ERP and MES systems and provides report data for further analysis. A Maintenance Planning Software solution can therefore be connected to operational execution without blurring the tasks of the systems of record.
A good way to start is to map a single maintenance or inspection process digitally as an example and check its effect on finding quality and follow up in live operation.
Which criteria should I use to select TPM software?
Suitable TPM software has to make operational tasks easy to execute, capture findings in a structured way and fit into ERP, MES or CMMS without duplicate data storage. Feature scope alone is not enough. What matters is shopfloor suitability, integration capability, governance and measurable value.
Check the following criteria in particular:
Asset and master data integration: are there documented interfaces to ERP, MES and CMMS and clear rules for the system of record?
Maintenance planning: does the solution support time, usage and condition based triggers as well as recurring plans?
Digital checklists and work instructions: can text, image, video, measured values, limit values and conditional steps be combined?
Finding and task management: do deviations turn directly into prioritized tasks with owners, deadlines and escalation?
Qualification management: does the system check roles, releases and validity before assigning a task?
Health, safety and environment: does it support safety walks, 5S or 6S, safety audits and documented responses to critical findings?
Mobile use: does the application work ergonomically on the shopfloor and offline when needed?
Evidence: are versions, releases, time stamps and maintenance reports fully traceable?
Analysis: can failure reasons, findings, MTTR, MTBF, task completion and maintenance intervals be evaluated based on data?
Scalability and administration: can the business functions maintain standards themselves without needing programming for every change?
IT security: does the solution meet requirements for roles, permissions, authentication, logging, data storage and backup?
Rollout capability: can a clearly bounded pilot with real users, machines and interfaces be run?
The recommendation is: assess solutions with three to five real, end to end usage scenarios instead of a long feature list. For example, have an operator capture a critical finding, escalate a measure, assign it to qualified maintenance and follow the completion through to the report. The better solution is the one that supports this flow with few media breaks, clear data ownership and high acceptance on the shopfloor.
FAQ
How did TPM develop into a holistic concept?
TPM developed out of the shift from repair after failure through planned prevention and autonomous maintenance to a cross functional production system. As automation grew, a purely technical maintenance department was no longer enough. Plants therefore trained machine operators for standardized care and inspection tasks.
This development explains the holistic character of the concept. The focus is not on transferring as much work as possible to manufacturing, but on collaboration across all functions for reliable equipment and stable quality. This logic aligns closely with kaizen, lean production and continuous improvement.
Which results should a practical example of a digital TPM implementation show?
A robust practical example should show the effect of a digital TPM implementation using metrics for equipment availability, process stability and cost that were defined beforehand. Individual results cannot be transferred to other plants as a general rule. Baseline, machine park, failure profile, wage structure, data quality and implementation scope determine the effect that is actually achievable.
So define baseline values before the project starts. Measure downtime, process deviations, MTTR, external maintenance cost and processing times using the same definitions before and after the rollout. Only then can the contribution of digitalization be separated from parallel improvements.